
Pair plot in seaborn
In the last tutorial plotting was made using only distplot ( ) function and passing different parameters through it.
Now in this tutorial , we shall work with another plot names as pairplot.
This plot function plots with all possible columns present in the data set. In this tutorial also we would be working with the same data set .
Let us import the data set and work with it.

Now we would pass
sns.pairplot ( data_set_name )

Few important parameters of these functions and their usage:
| Parameter | Its usage |
| hue | This should be a string and a categorical value column from the data set, it differentiates all the graphs with those categorical values. Please refer to the plots below to understand clearly. |
| palette | Color or theme of the graphs to differentiate |
| kind | Type of plot we need like scatter for scattered pointshex for hexagonal shaped pointsreg for regression ( will learn deeply in machine learning ) |
| x_vars | To change the x parameter |
| y_vars | To change the y parameter |
| corner | If True then the axes of upper triangle ( off diagonal ) will be removed. |
| dropna | Drop any missing data from the data set before plotting. |
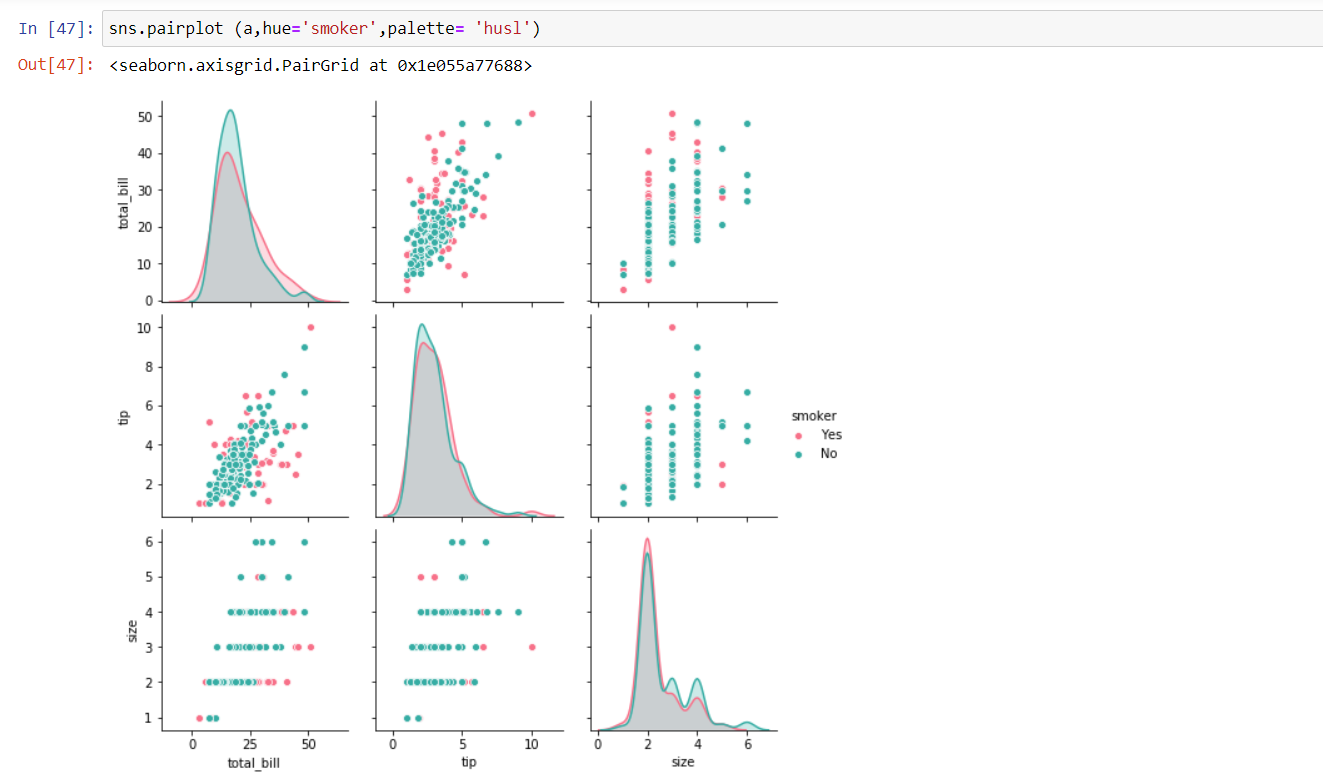
hue parameter :

palette parameter:
To know all the color palettes visit the official website of seaborn library.
Rugplot:
As already discussed what a rug plot is. To plot a rugplot
Sns.rugplot ( dataset_name [ ‘col_name’ ] )

This plot isn’t used much but this plot is a parameter to other plots as ‘kind’ name and it should be passed as rug. This is the end of this tutorial Pair plot in seaborn.
Topics of upcoming tutorials:
- Categorical plots
- Heatmap
- Grids
- Regression plots